Working with Metrics
Goalify excels at helping people gain consistency and to make lasting changes. It provides you, as their coach, with a detailed look into their real implementation rate of your suggested strategies and objectives. Metrics can be attached to your clients' goals to easily collect information beyond their completion and performance level. This will help you better understand the context in which performance data was recorded.
Let us explain with two examples. Imagine asking your client to review her/his week each Sunday according to specific topics (focus, perceived consistency, wellbeing). With Goalify you can make sure that the client is completing the task regularly, but what about the actual answers to the questions raised?
Or imagine asking your client to go running three times a week. Wouldn’t it be great to get insights into the pace, heart rate and a client’s feeling for each run too?
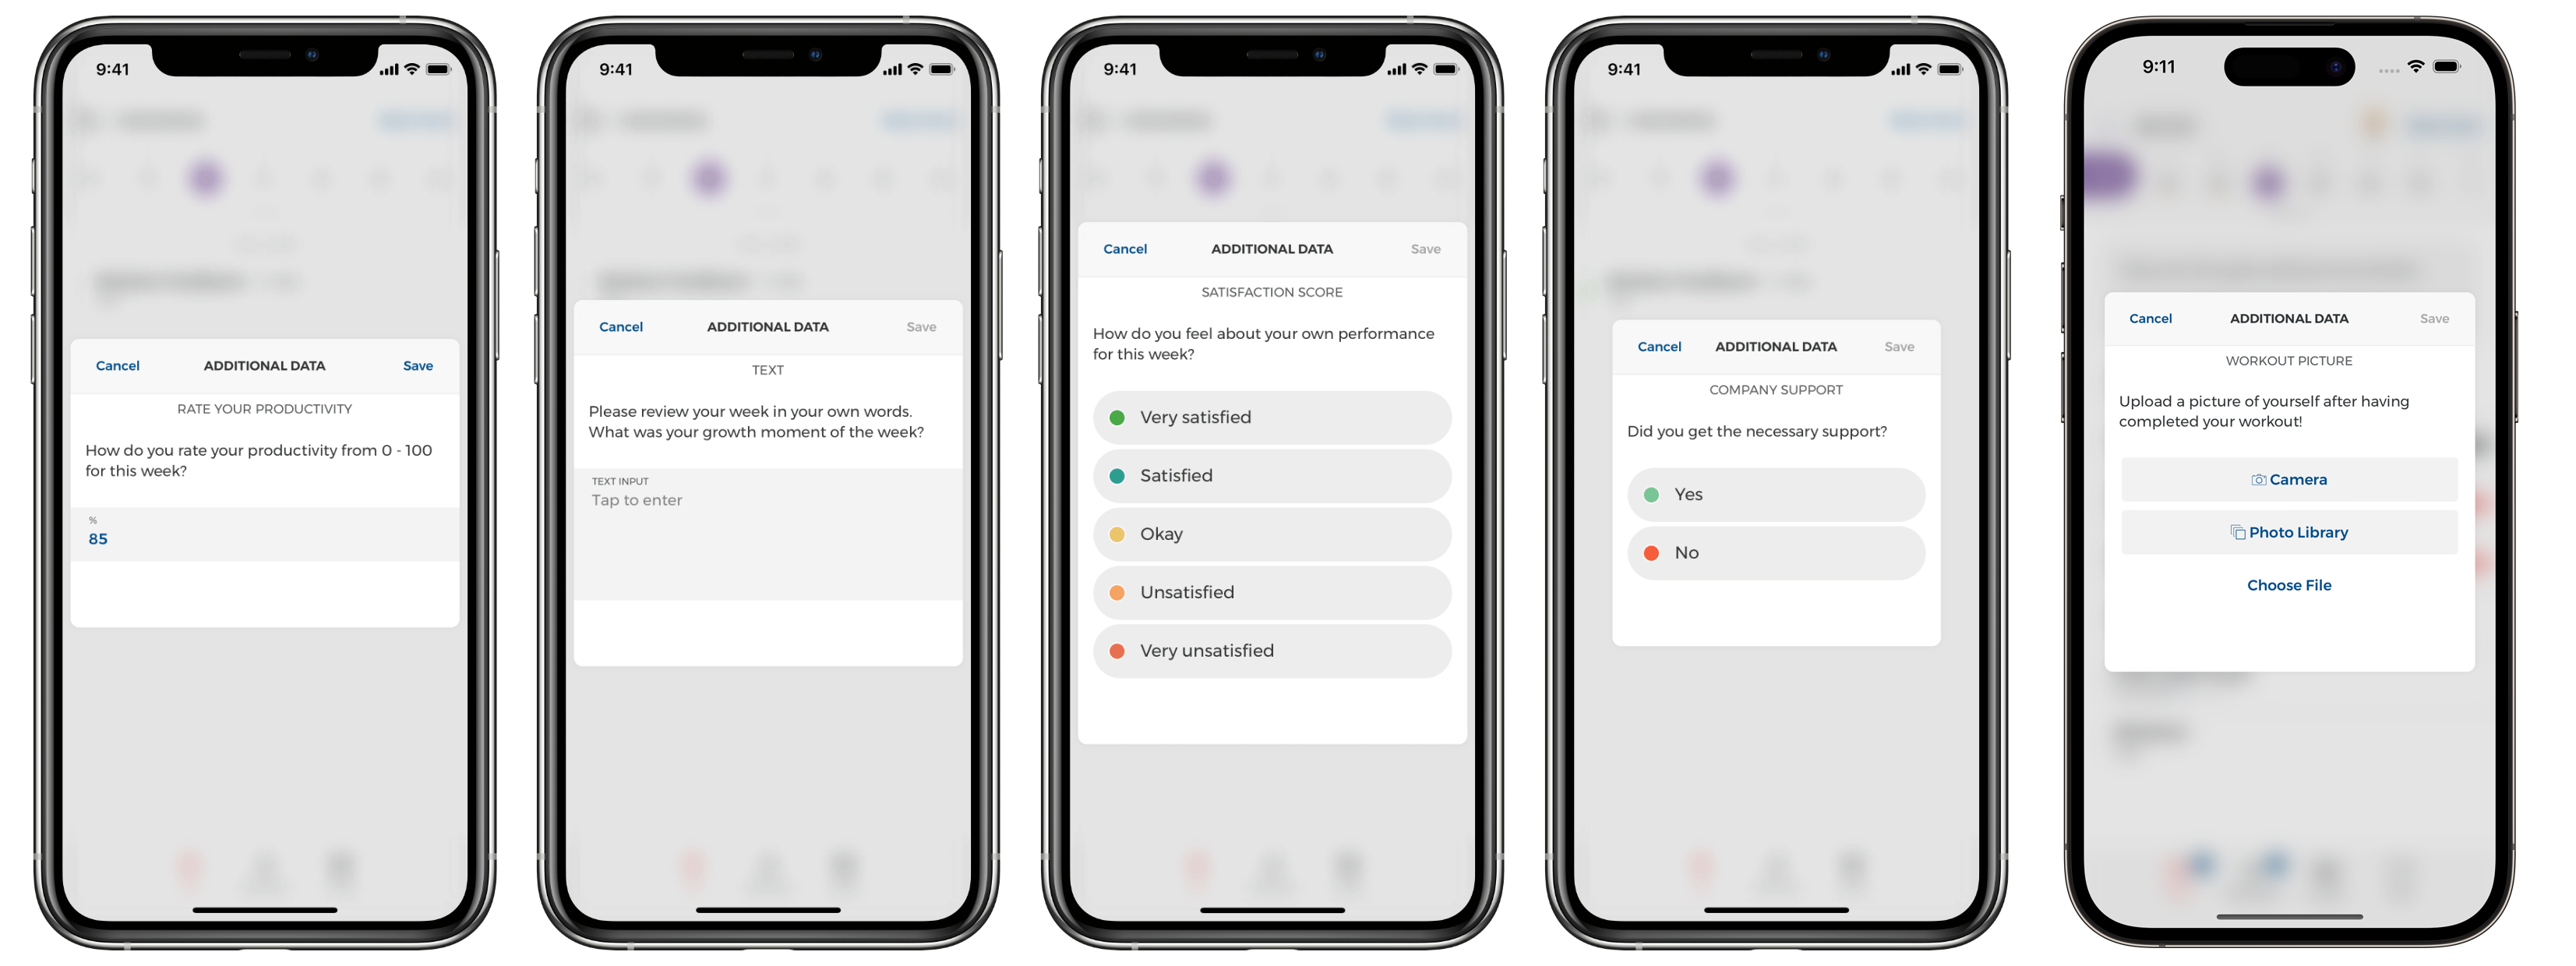
This is what we designed metrics for. Simply add the necessary metrics - which can be numeric, plain text or pre-defined answers - to your clients' goals and they will be prompted to record their responses with every activity they log.
You as a coach can review the recorded data and its development over time, providing you with a more complete picture of your clients’ wellbeing and progress - both on an individual level of each client and across all clients. And thanks to our interface engine, you can build your own dashboards with beautiful and interactive charts and KPIs based on the data collected through metrics.
Metric Types
Goalify does not come with a pre-set list of available metrics but instead offers you the ability to create your own metrics based on these basic metric types:
- Numerical
Let your clients record a numerical value to answer a metric's question. Using the advanced options, you can set specific boundaries for the allowed value range. A numerical metric can also be used as the unit for goals of type target amount or limit.
- Text
Ask your clients to record their responses as text. You can pre-fill the answer box to provide additional structure.
- Selection of Choices
Define pre-set answers and let your clients select the one with the best fit. You can use colors to differentiate the options even further.
- Binary
Let clients choose between two options. For example, yes or no, succeeded or failed. A binary metric can also be attached as the main metric to a task or avoid goal.
- File Upload
Clients can upload one or more pictures and/or files from their device.
Metric Settings
Setting up a metric is very easy and there are only a few settings that you have to be aware off:
- Name
The name of the metric. As with goal names, try to keep it as short as possible.
- Description
It helps the client to better understand the purpose of the metric. The description is shown with the metric.
- Type
Select one of the four metric types available: numerical, text, selection of choices and binary.
- Options
Depending on a metric's type, you can further define the behavior of the metric.
These are the available options for the different metric types:
- Numerical
-
Unit: Describes the unit used to record responses for this metric. It is text-based and does not have an effect on the value recorded.
Minimum & Maximum: Set a value range for values to be recorded. Values outside of this range get rejected. This is an advanced setting.
- Text
Prefill: Add a text which is shown in the recording text field of the metric.
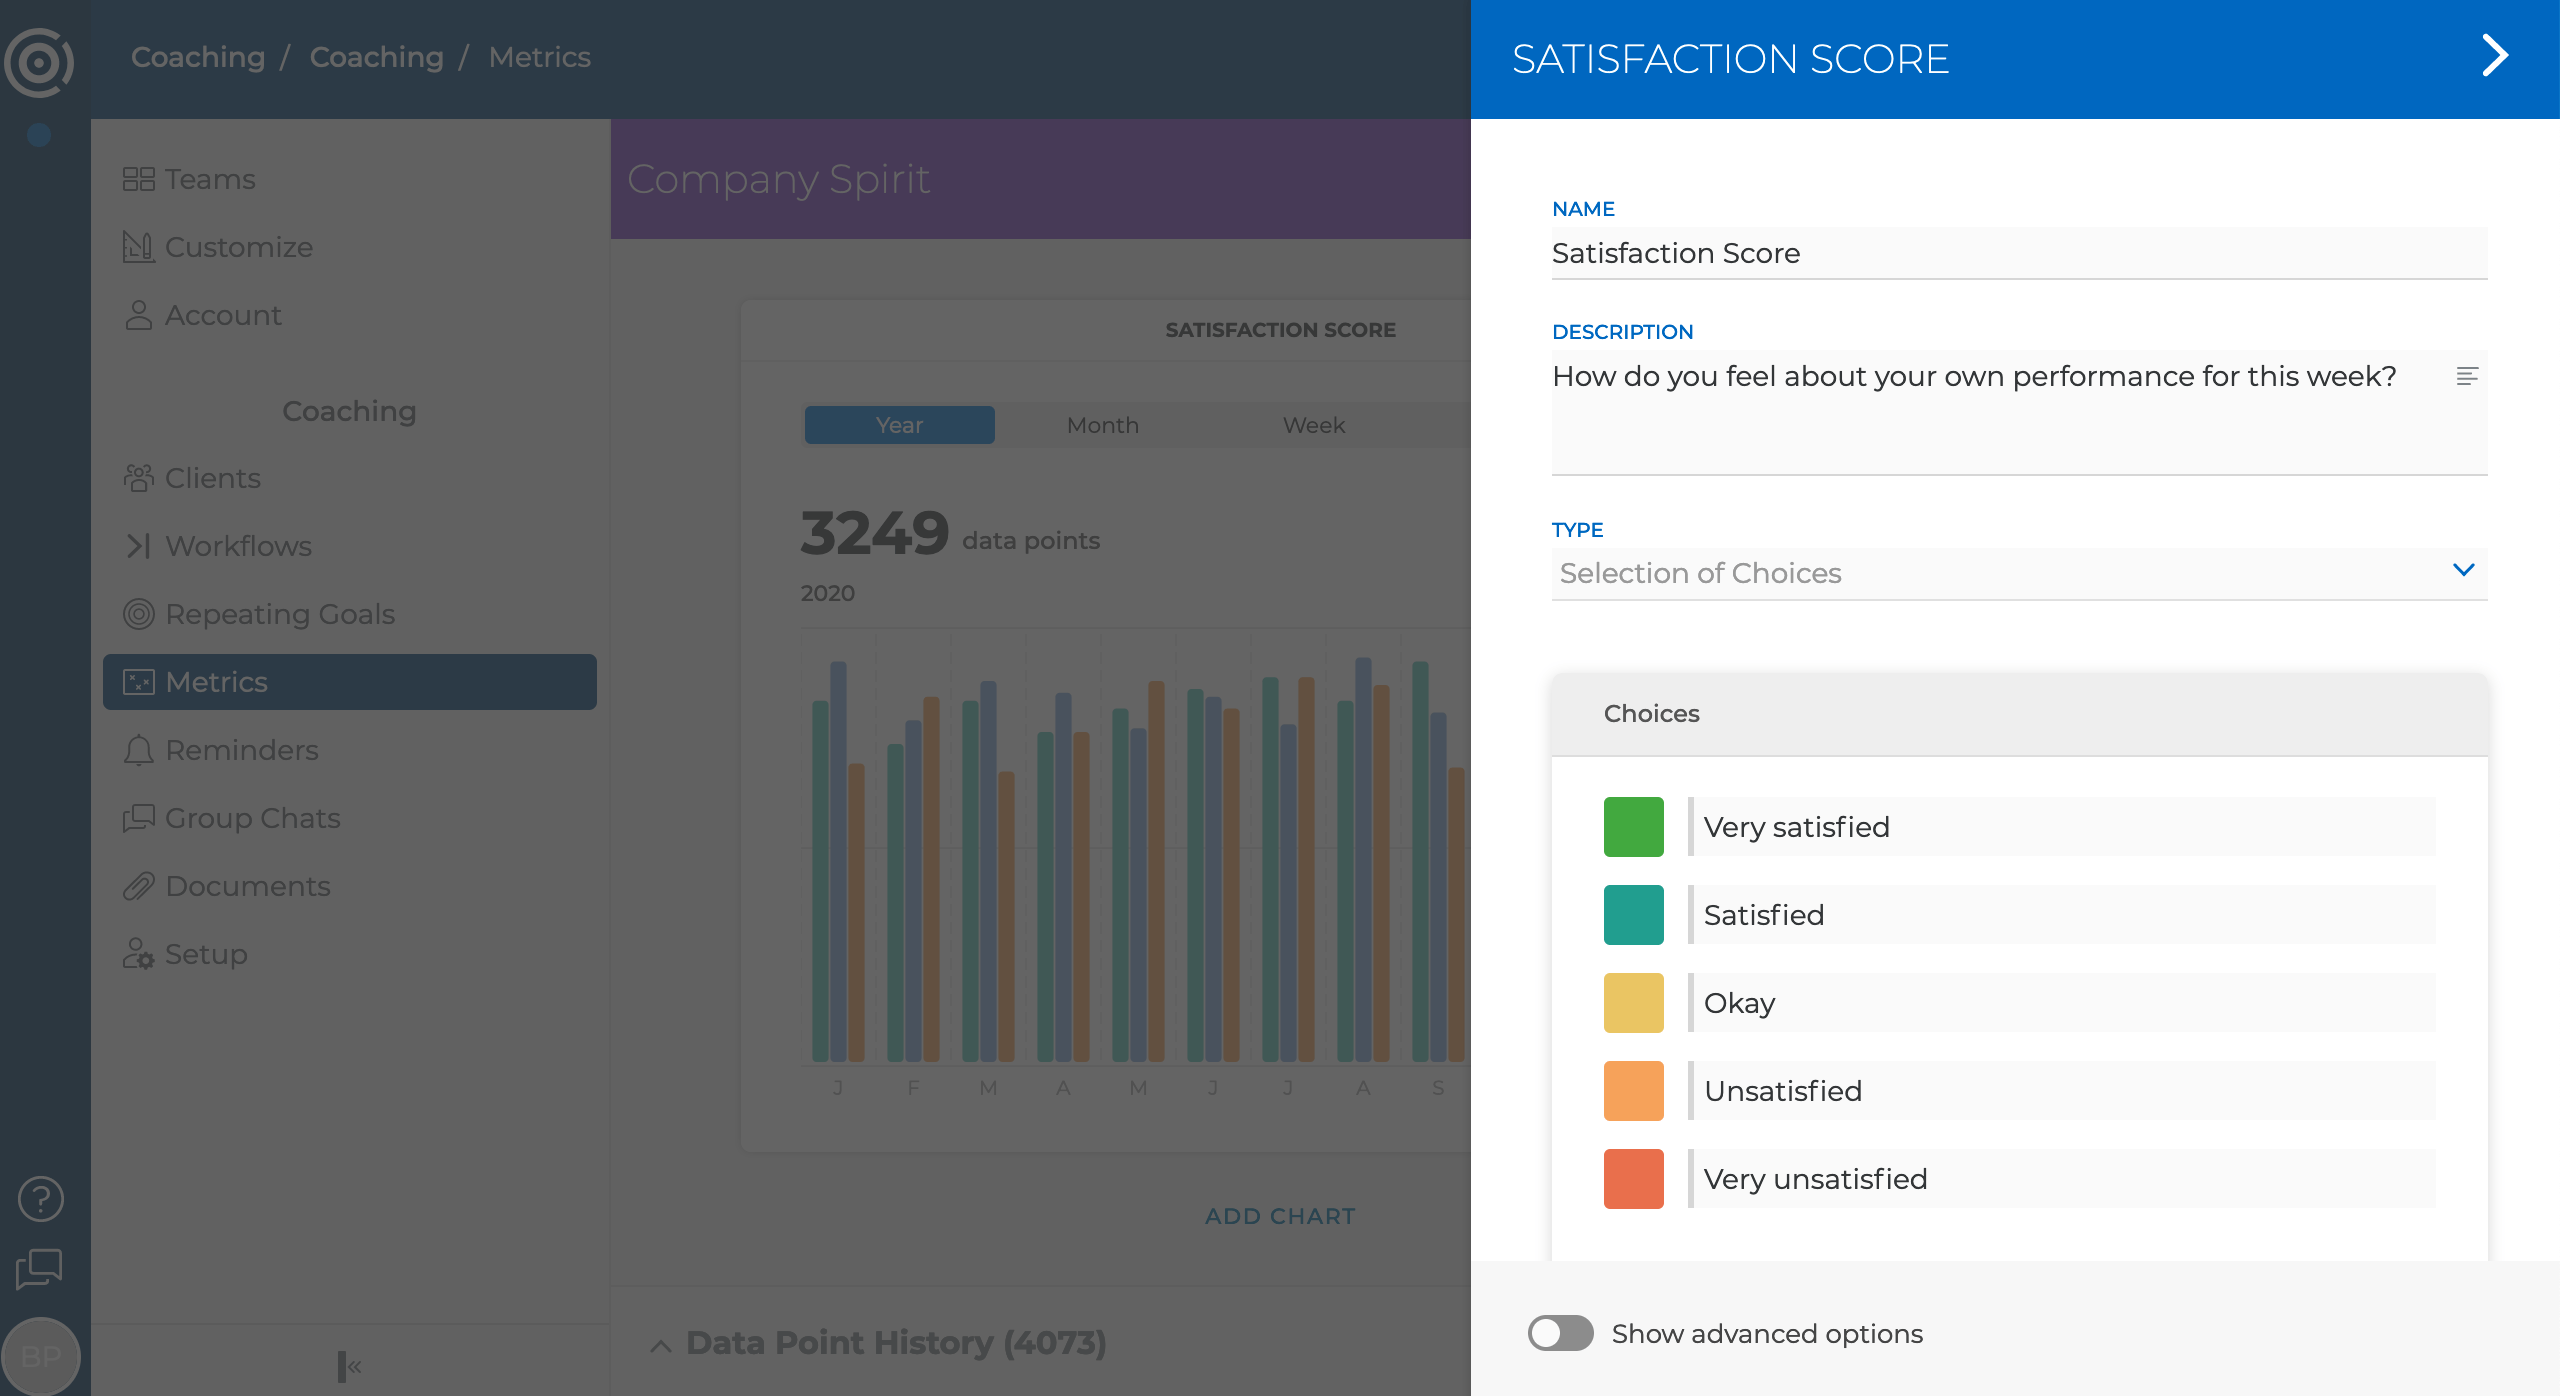
- Selection of Choices
Choices: Add the choices available for clients to select when answering the metric's question. You can set the color and label. Drag the different options to rearrange their order.
- Binary Choices
Choices: Select the color and label for the two available answer options.
- File Upload
Quality: Depending on your needs, you may choose to set the maximum image size in pixels and the image compression rate. Lower values will result in a faster upload, but may decrease the image clarity.
Analytics of Metrics
When you add a metric to a client's goal you will notice additional metric menu entries appear on the client's goal itself, the client dashboard, and the team level. Or if you think of it as a hierarchical structure - from goal, to client, to team - on every reporting level above the goal. On each level, you get access to all data points recorded and the option to run your analytics on them.
Let's explain this with an example: Imagine you are a running coach and you add a weekly running goal to all your clients. You ask them to record their miles, heart rate and pace for all their runs using the metric feature. You can analyze each goal individually and see every value recorded, while you can also see and analyze these values on a team level - meaning across all your clients. This makes it very easy to see how many miles all of your clients ran together, the average miles covered by clients, the maximum, the minimum and more.
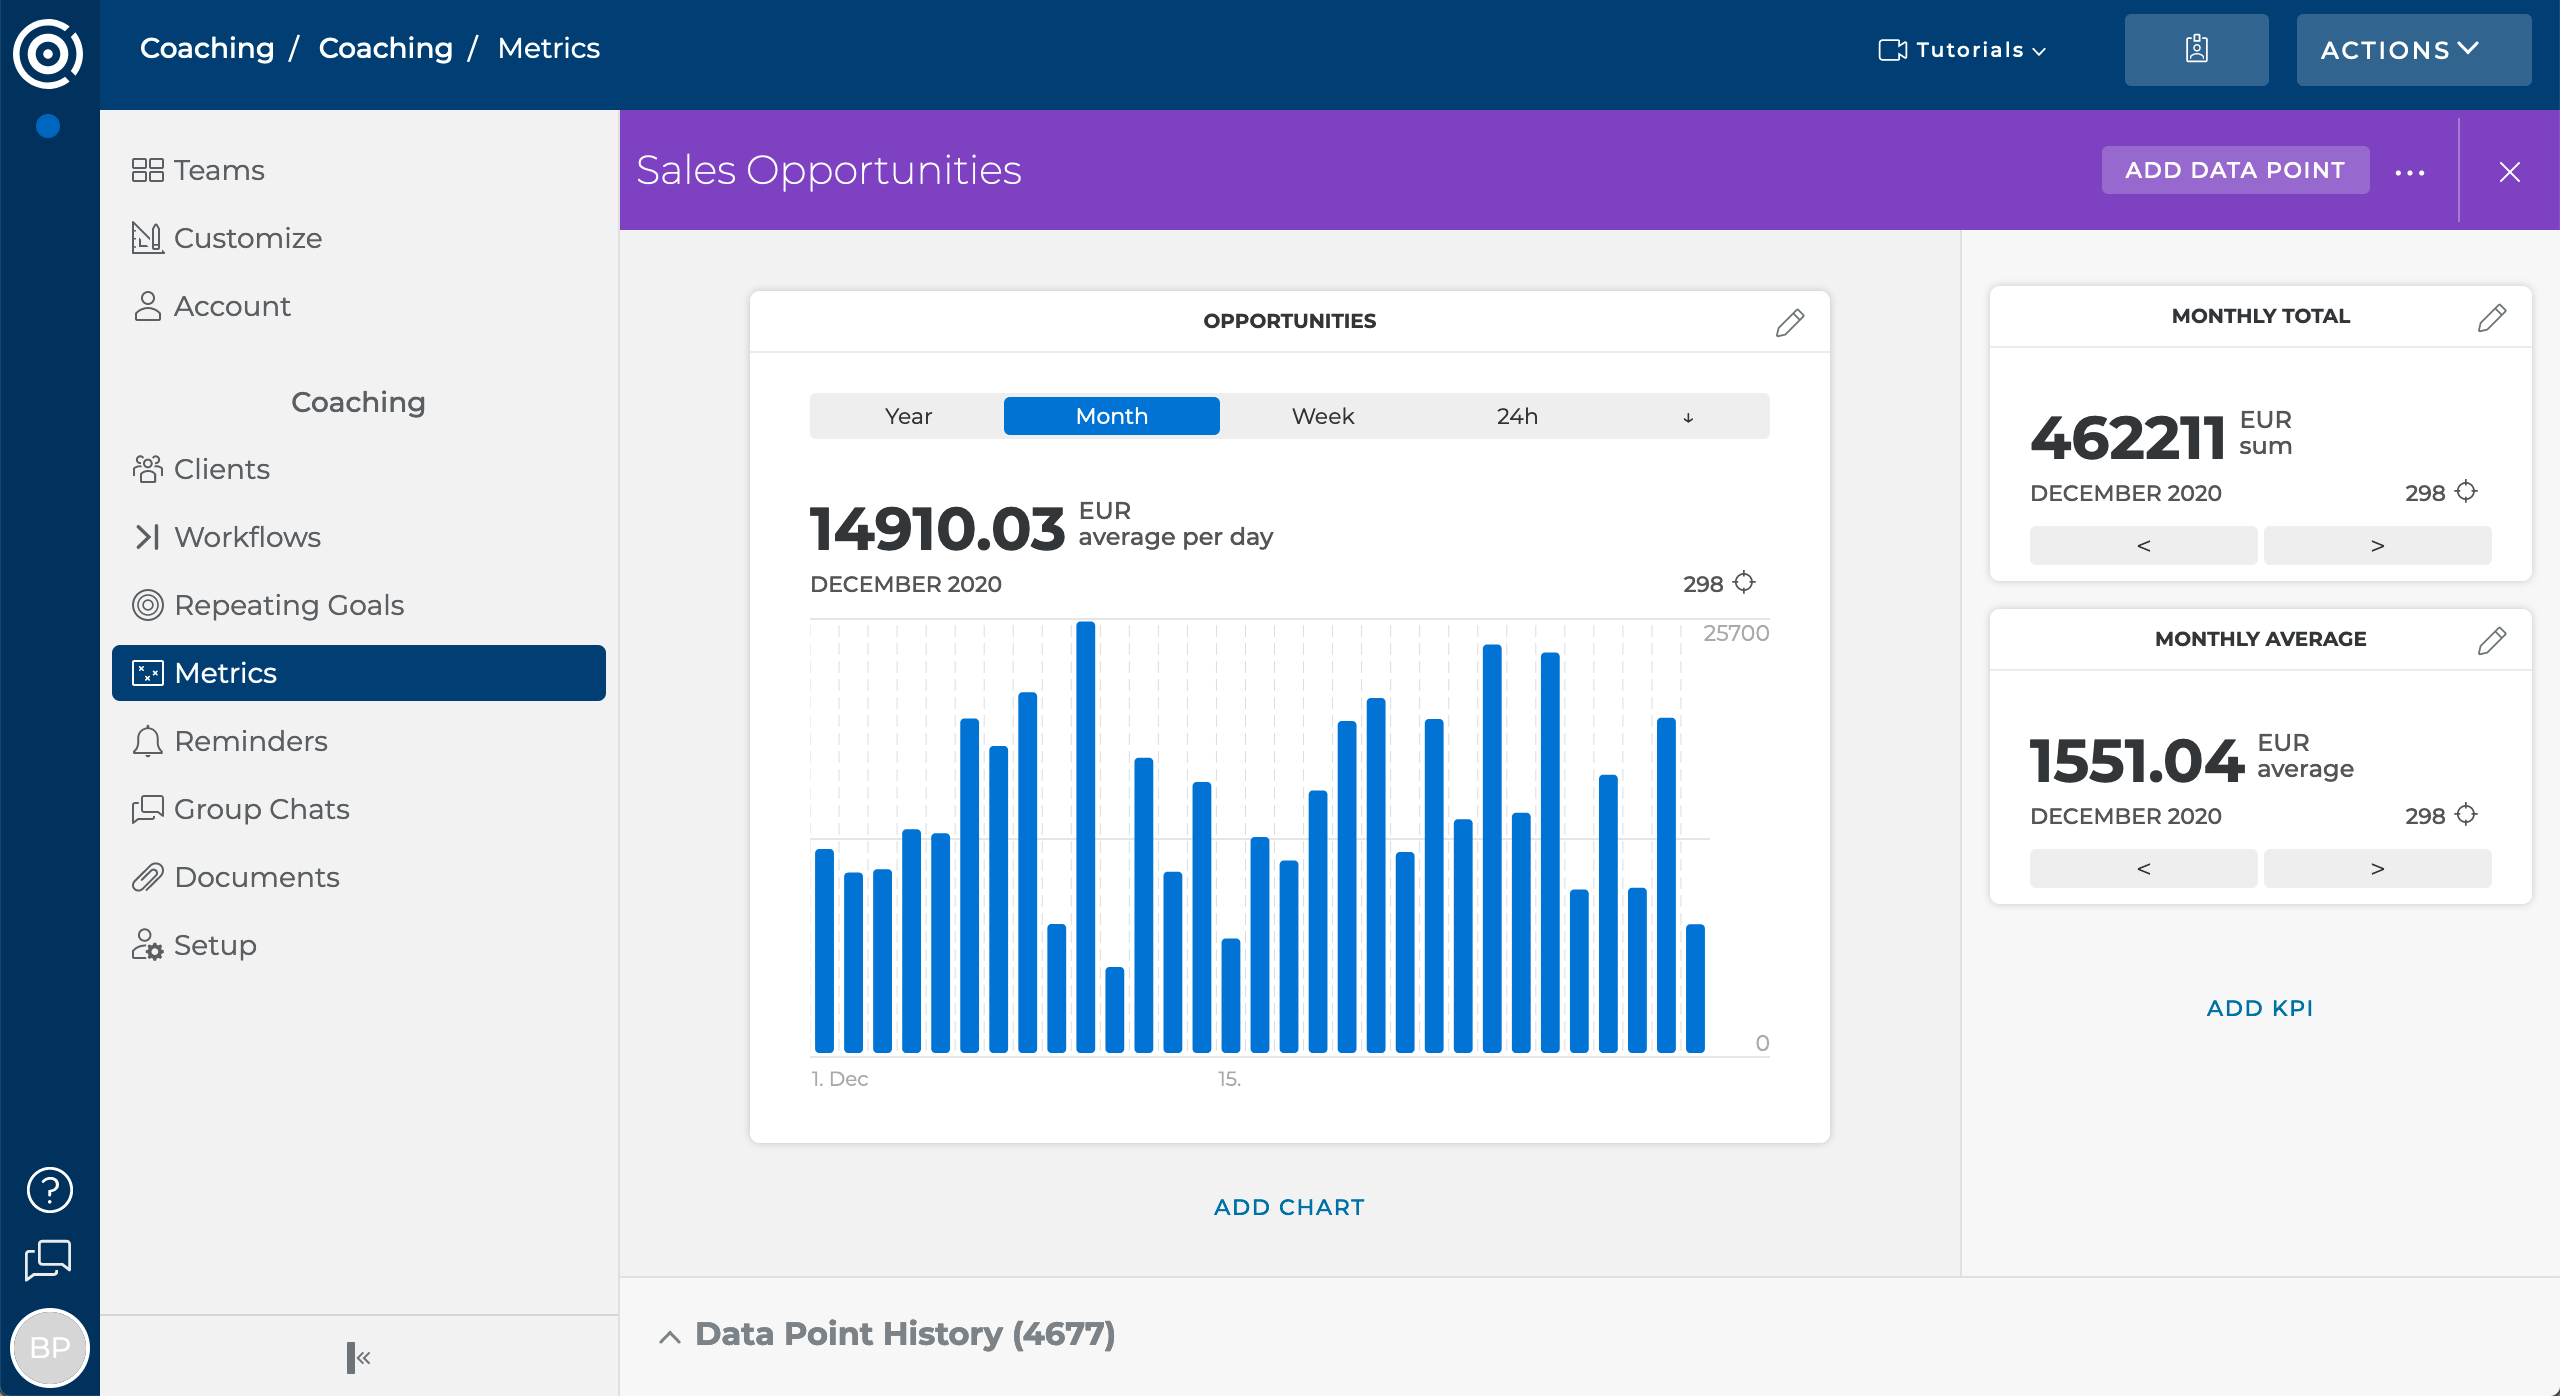
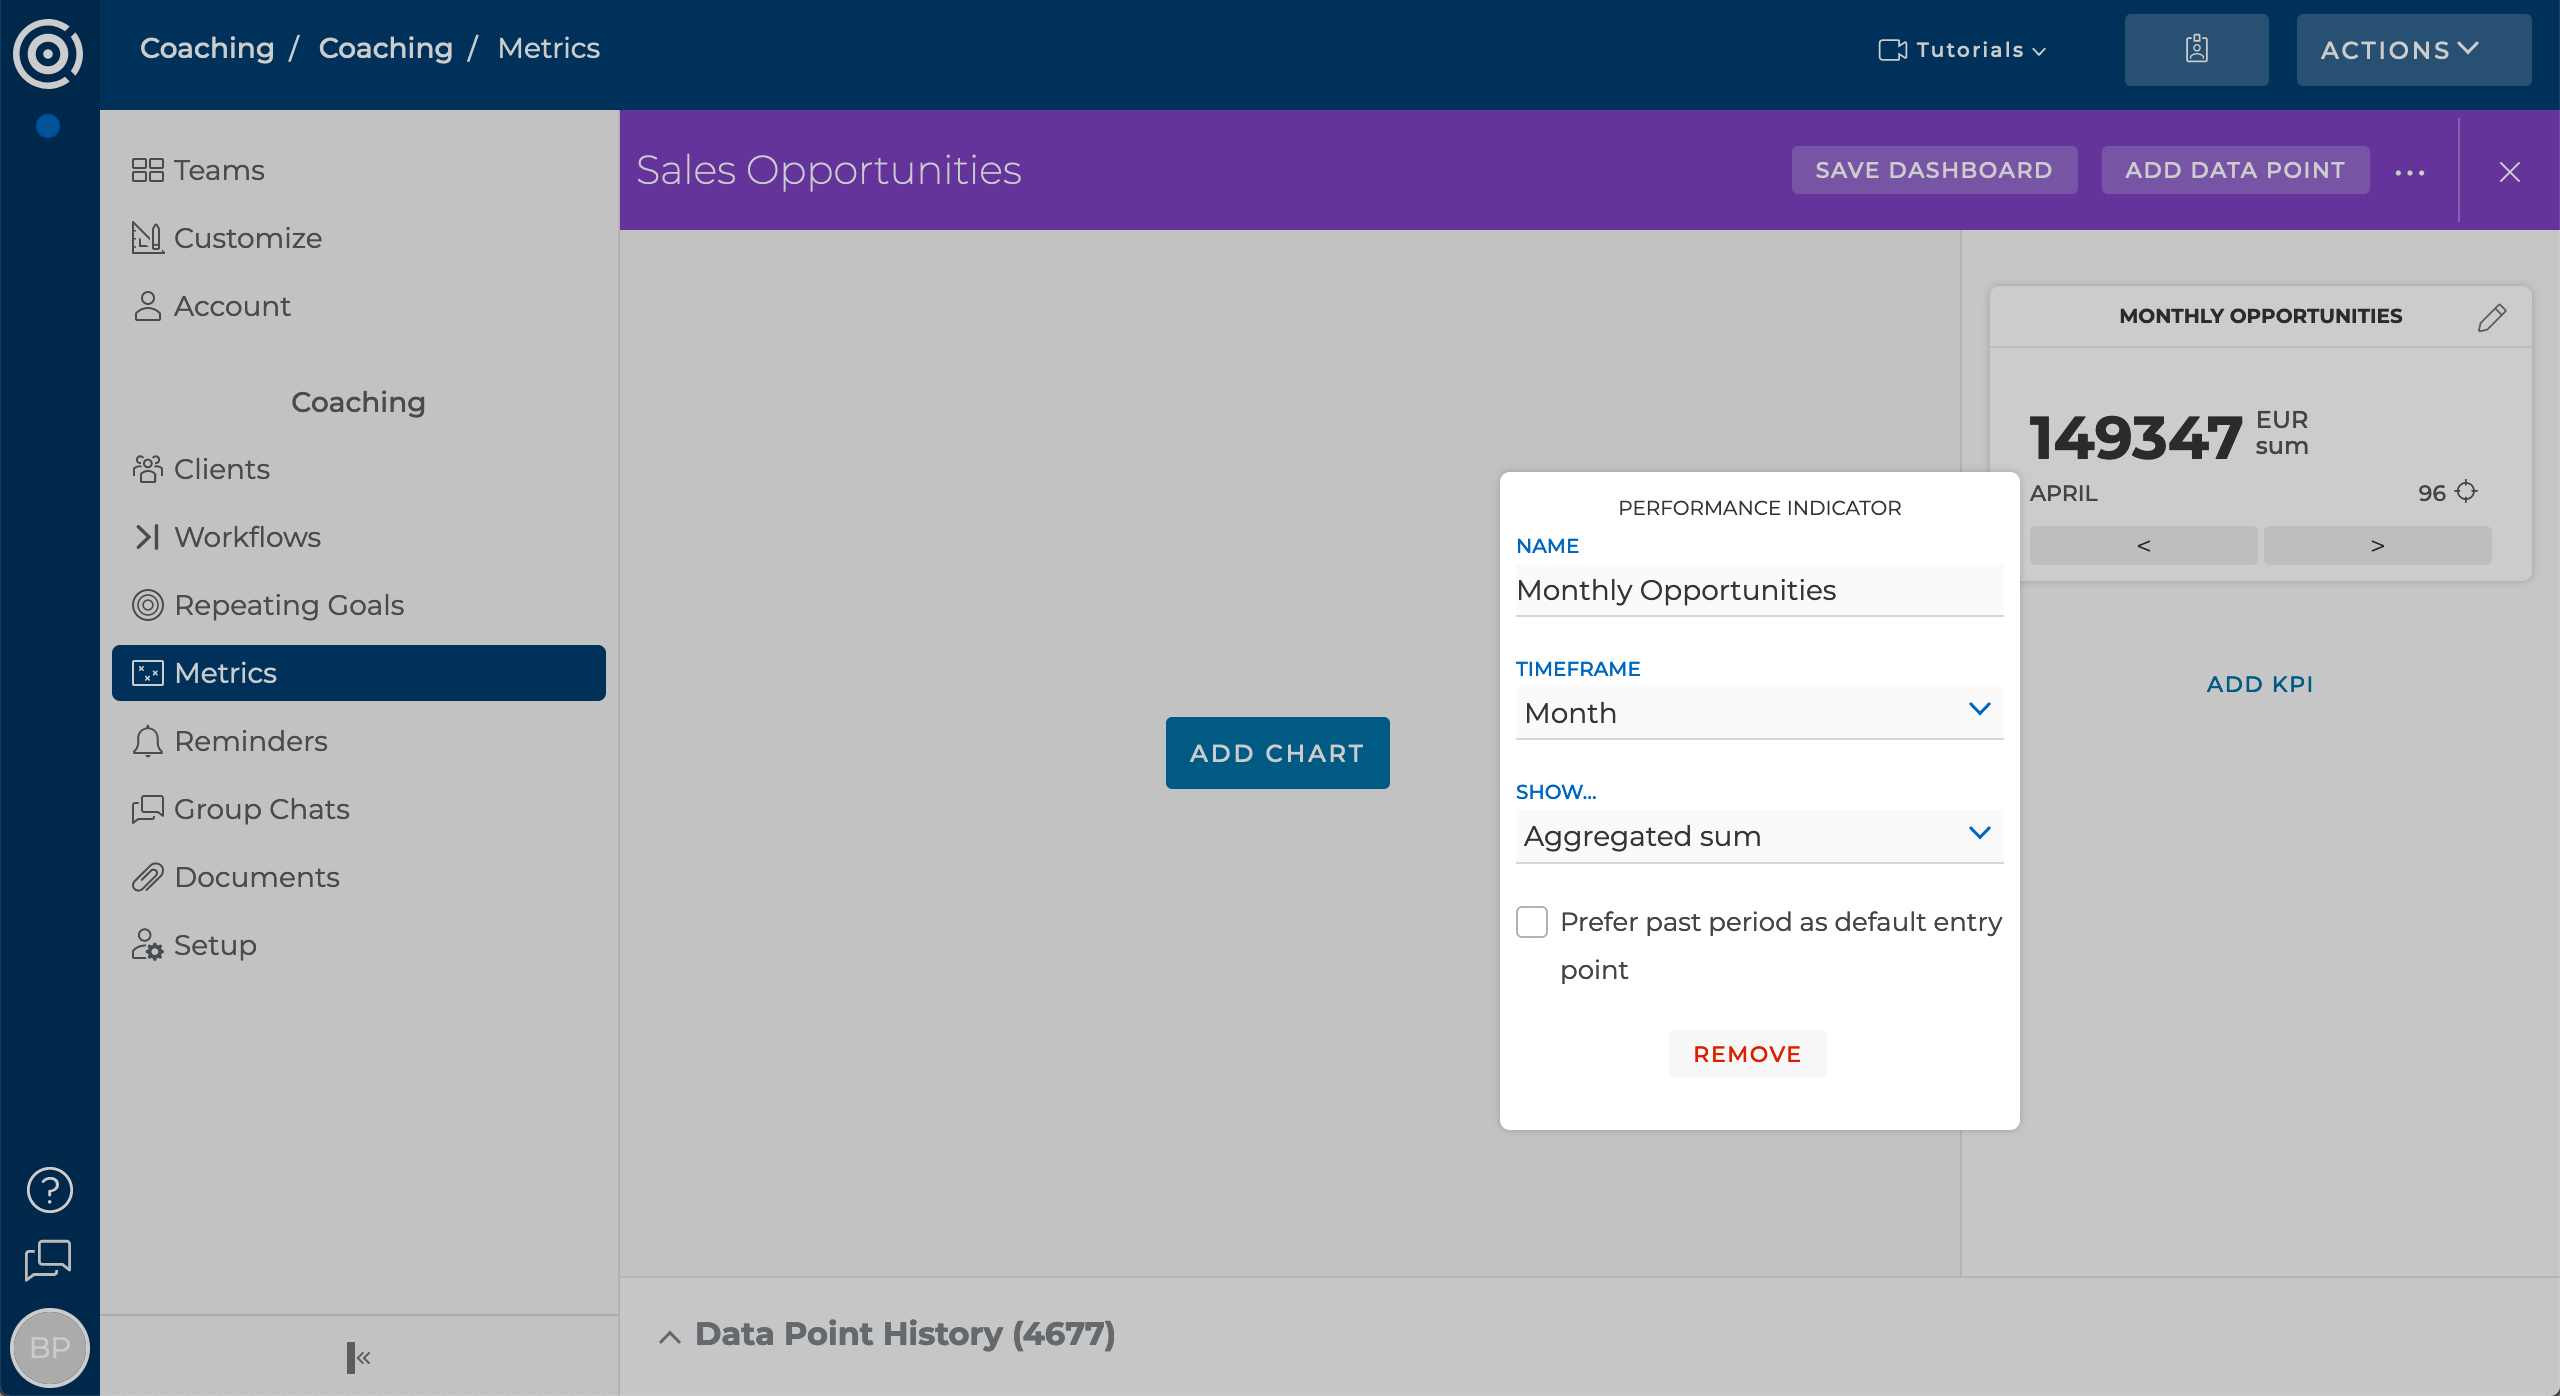
A metric's analytics dashboard
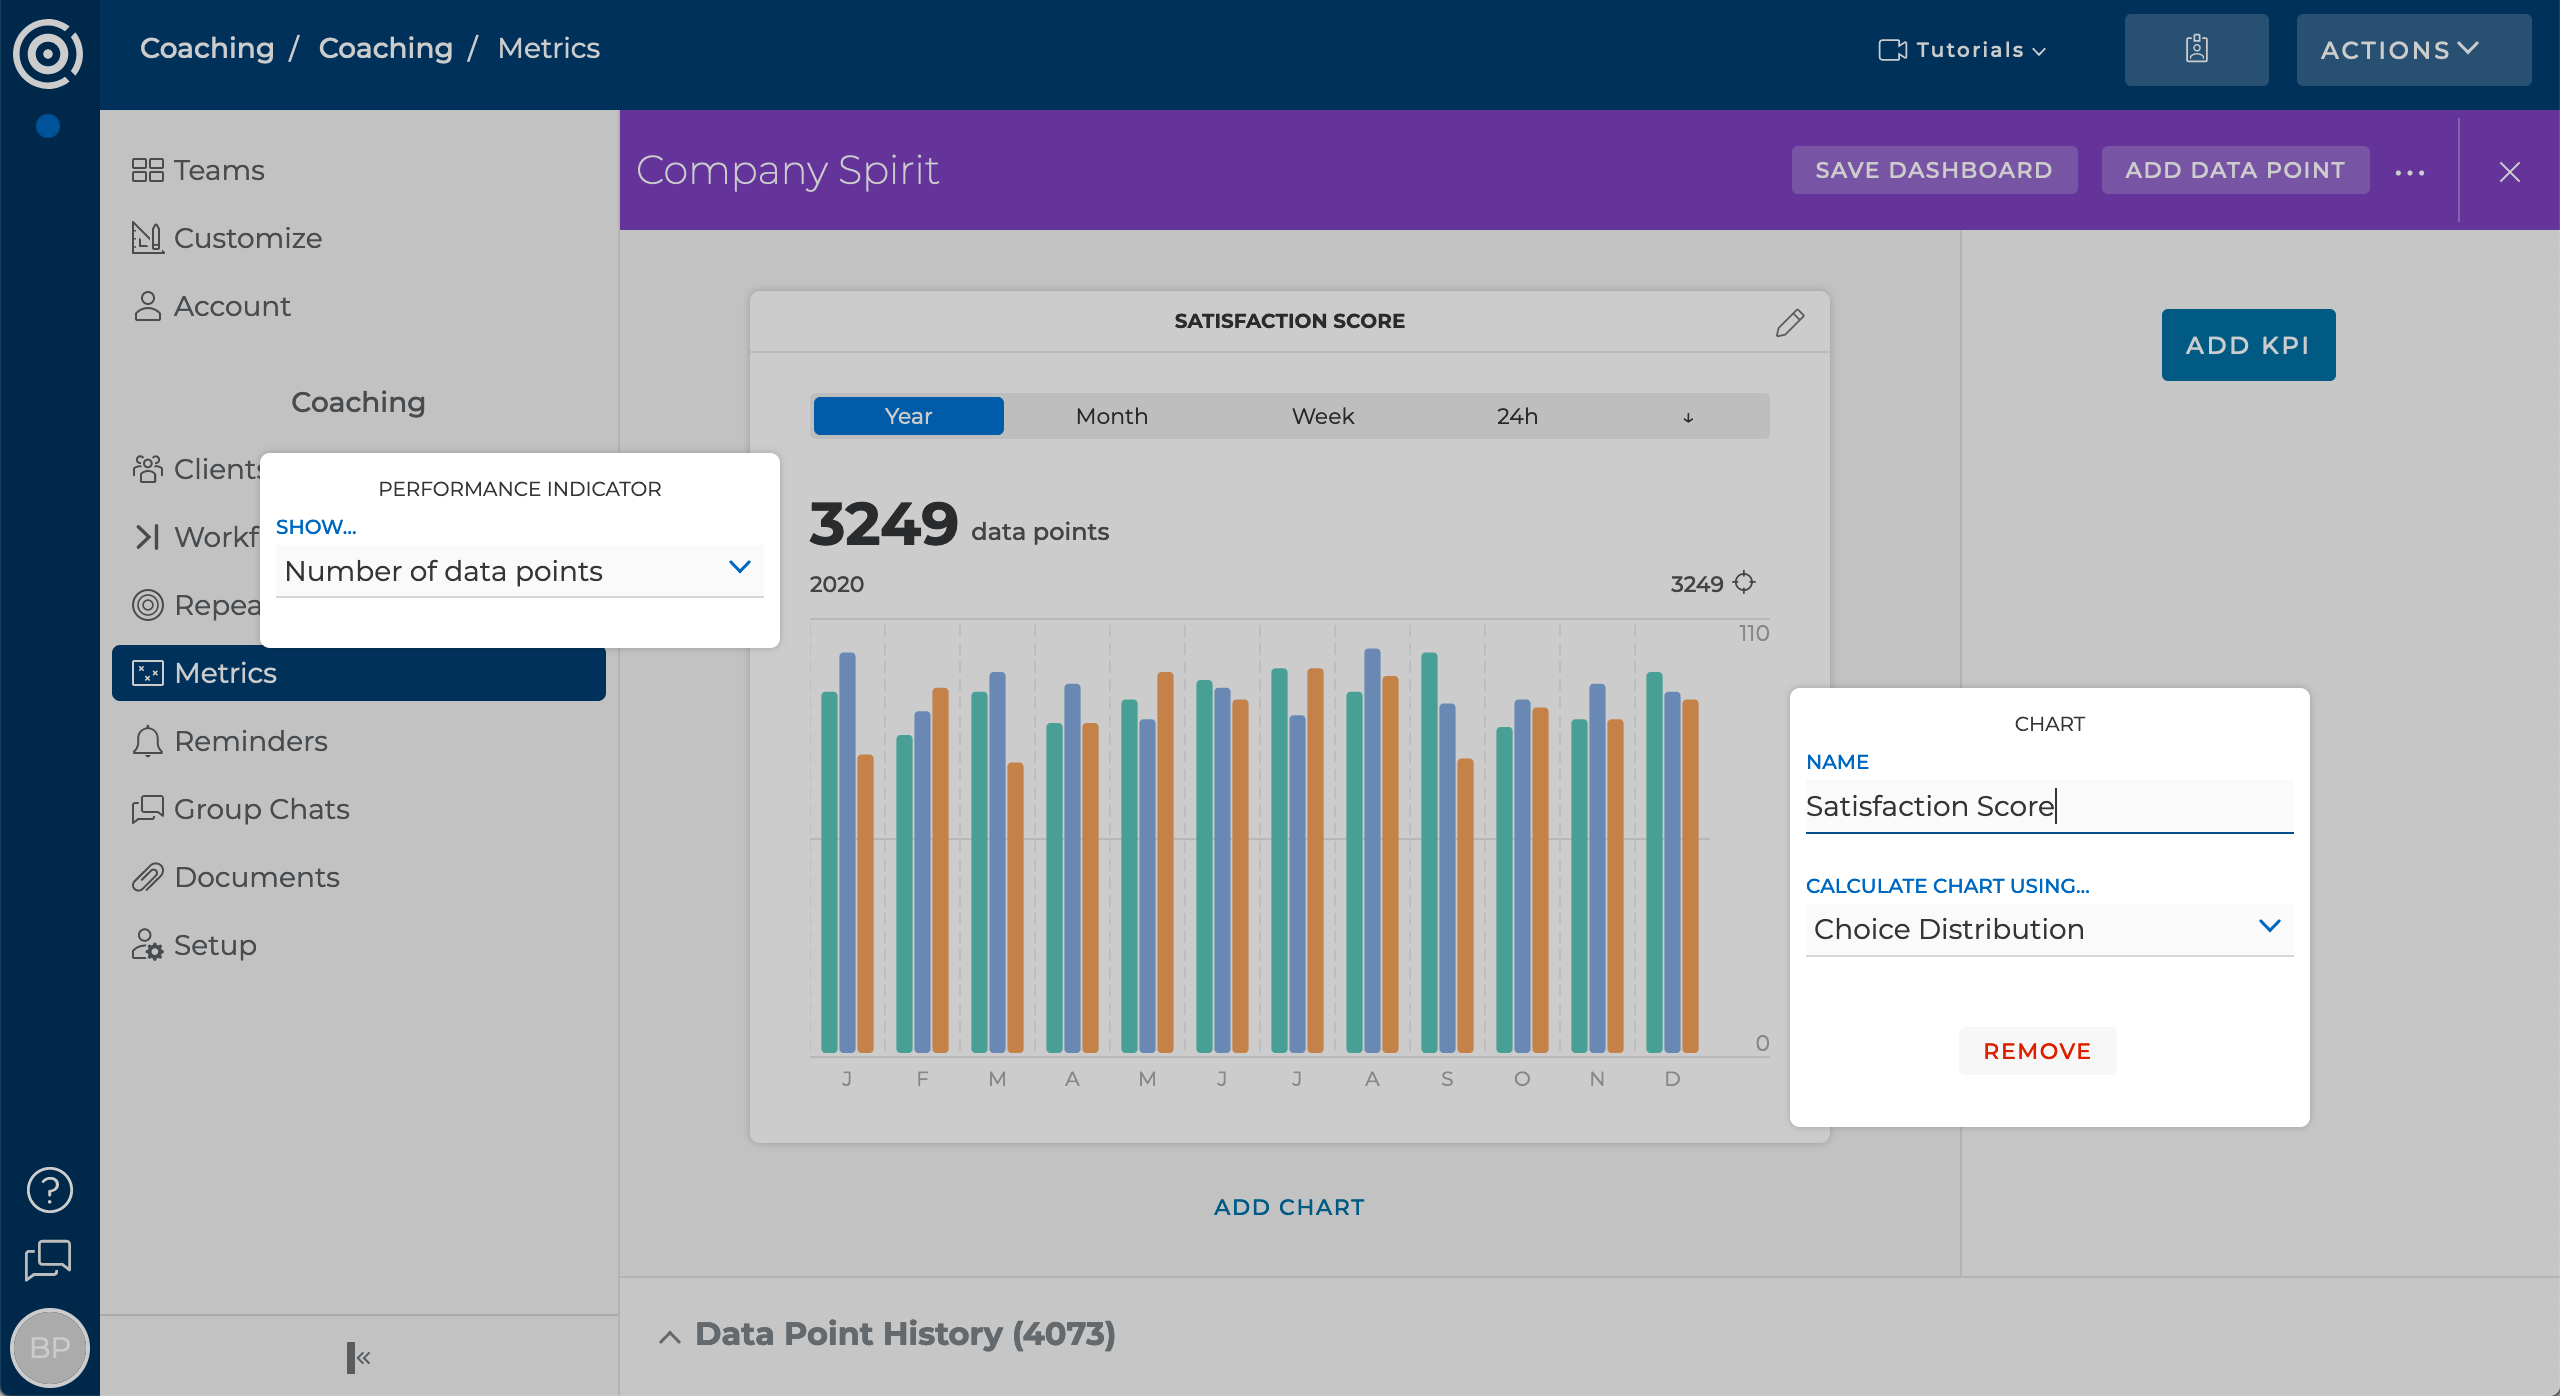
Quick Setup Tutorial
- From a metric screen, click on the name of the metric
- Use the Add Chart or Add KPI button
- Use a chart's or KPI's settings dialog
Every metric has its own analytics dashboard that you can set up using charts and KPIs. Charts give you a visual indication of all values recorded for the selected timeframe. KPIs provide you with a single value quickly indicating key performance data.
Charts
Each chart gives you access to the following settings:
- Chart - Name
Shown as the headline of the chart. If left blank, the headline will be based on the data displayed.
- Chart - Calculate chart using
Offers an array of different options for data manipulation and visualization.
- Performance Indicator - Show
The performance indicator consolidates the shown data points into a single value. Offers an array of different options.
- Performance Indicator - Calculate using
The performance indicator can be calculated across all data points or on the results of every shown period.
- Performance Indicator - How to treat periods without data?
When you choose to base the performance indicator on the results of each period, you can ignore periods without data or have these periods be included with a value of zero.
KPI
Each KPI gives you access to the following settings:
- Name
Shown as the headline of the KPI. If left blank, the headline will be based on the data displayed.
- Timeframe
Select the timeframe to base the KPI on.
- Show
Offers an array of different options for data manipulation and visualization.
- Calculate using
The performance indicator can be calculated across all data points or on the results of every shown period.
- How to treat periods without data?
When you choose to base the performance indicator on the results of each period, you can ignore periods without data or have these periods be included with a value of zero.
- Prefer past period as default entry point.
Do not base the KPI on the current period but the one before.
Export Metrics Data
Quick Setup Tutorial
- Click the Show data points button of any metric chart or KPI
- Choose the Export option using the Action button
- Copy the data to your clipboard or download it as file
You can export the data that make up a metric chart or KPI easily. You can either export the whole chart by clicking the Show data points button or the data making up an individual bar by double-clicking the respective bar. You can now review the individual data points and select the Export option from the Actions button.
You can export data as JSON format or as CSV with different delimiter options.
Main & Additional Metrics
When one or more metrics get attached to a goal, the person working on the goal can record the answers to these metrics with every activity he/she adds to the goal. To record an answer, a client will notice a metric entry prompt when adding an activity. We label these metrics, which get recorded alongside a goal's progress, additional metrics.
You can choose to use a metric to act as the unit for target amount and limit goals. When a metric is used as the unit of a goal, every activity recorded will also be added as a datapoint for this metric. Since the recorded values are the same, the user does not have to enter the value twice. In fact, the client will not even notice any differences during activity recording compared to a goal without an attached metric.
We label a metric that is used as the unit for a goal as main metric.
Here is a quick example illustrating the above: Imagine you set your clients a goal of running a certain amount of miles each week. You set up a weekly target amount goal and as unit you use a numerical value labeled miles. To learn more about each run your clients track, you attach additional metrics asking the client to provide feedback on the run's pace and average heart rate.
Every time a client logs a run, he/she records the number of miles using the usual activity progress. In a second prompt, he/she is asked to record the values for pace and average heart rate.
Adding metrics to goals
Using a metric as a goal's unit
Quick Setup Tutorial
- Open the goal's setup screen
- From the unit field, select the Use a main metric as unit option
- Select the metric or create a new one
To add a metric to a goal, open the goal's setup screen. Depending on the goal type, you can add specific metrics as the main unit of the goal. You can attach any numeric metric as the unit for target amount goals. Task and avoid goals let you add binary metrics as unit.
From the unit field, select the Use a main metric as unit option. With the Search Team Metrics search box you can select an already existing metric. Using the Create New Metric button you can configure a new metric and use it with the goal.
Why use a metric as unit
A custom, text-based unit does not feature any analytics beyond the achievement level of the goal. A metric can be added to different goals, even across different clients and provides you with more analytical options - without adding any additional hassle for your clients.
Using additional metrics with a goal
Quick Setup Tutorial
- Open the goal's setup screen
- Set up your goal
- Use the Add Metric button on the Additional Metrics screen of the goal creation wizard
Metrics that you add on the Additional Metrics screen of the goal creation wizard are shown to the client when he/she records an activity for that goal.
To attach an additional metric during the goal creation wizard, follow all steps of the wizard. Use the blue Add Metric button on the Additional Metrics screen. With the Search Team Metrics search box you can select an already existing metric. Using the Create New Metric button you can configure a new metric and use it with the goal. You can attach as many additional metrics to a goal as necessary.
Required vs. Optional Metrics
By default, metrics are marked required and the client needs to respond to the metric when recording an activity. However, you can mark these additional metrics also as optional. Now the client can, but doesn't have to, respond to the metric when recording an activity.